CIS Charts
CIS Efficiency Charts
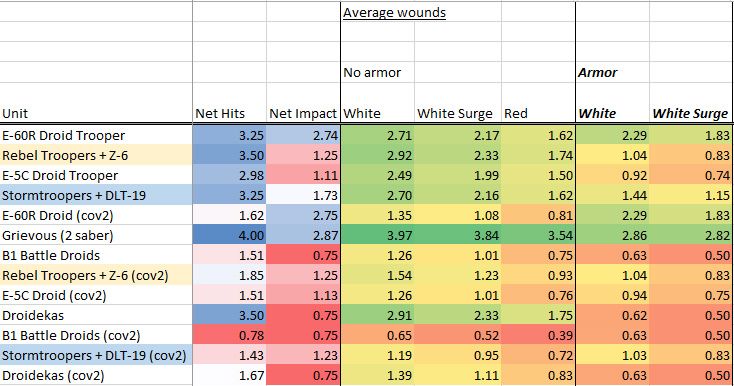
Here we will keep and attempt to update the CIS efficiency and wound by target charts.
Not every single load-out is shown, just the common ones. Blue/green is good (high wounds/efficiency), red is bad (low wounds/efficiency). For an explanation of what these charts demonstrate and why they are important, please read the Intro article here: Risk Management and Efficiency.
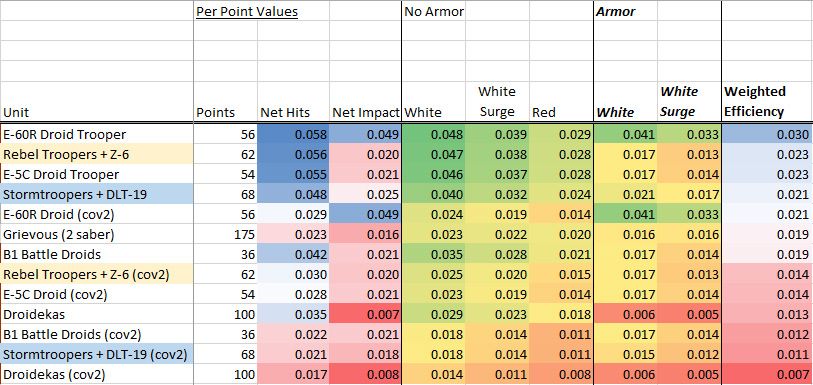
We added a column to the efficiency charts called Weighted Efficiency. This is just a given unit/weapons (non-impact wounds [red die] x 2/3) + (impact wounds [white with surge] x 1/3). So basically it weights non-impact wounds at 66% and impact wounds at 33%. The charts are sorted (descending) based on this value. If you want much more detailed breakdowns of the units and their loadouts, please visit the Unit Guides. The values are generated through a simulator; while this allows for easily accounting for static variables like cover, pierce, and critical X, it also means the values will be off by a decimal place or two. For example, you might see 2.99 instead of 3.00. As you can see with these shiny new CIS charts, the format of this page will differ slightly for the new factions, at least until we get new units. We’ve combined the no cover and cover 2 values into one chart. These calcs do not include surge tokens, which are obviously an important mechanic for CIS. We will dive more into those once we start hitting some CIS Unit Guides.
We’ve included the Z-6 and DLT numbers for comparison. All of the pools are without the extra trooper upgrade, but the heavy upgrades include the dice form the rest of the squad. I’m not going to do an article on these yet. I’ll let you draw your own conclusions until we have some real toys on real tables to play with.
CIS Efficiency Chart
CIS Wounds/Hits